PPI: Understanding the Producer Price Index and Its Economic Impact

Introduction
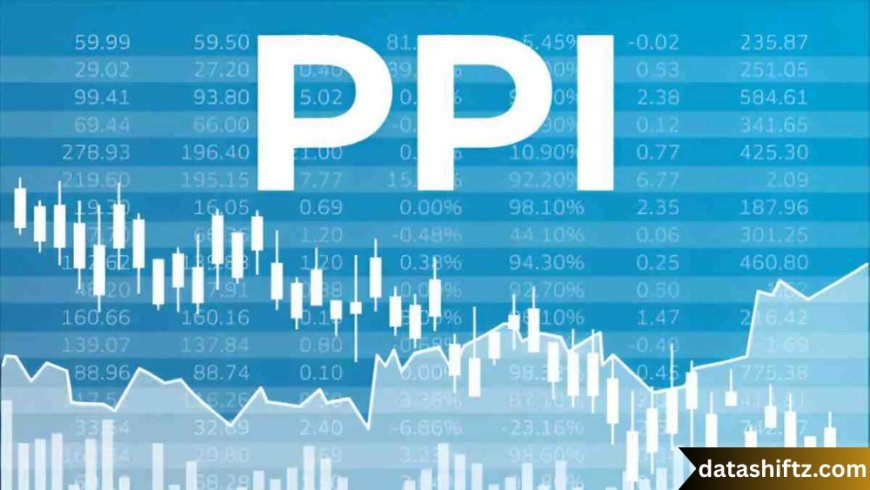
The Producer Price Index (PPI) is a crucial economic indicator that tracks the average change over time in the selling prices received by domestic producers for their output. Often seen as a precursor to consumer price trends, the PPI helps economists, businesses, and policymakers understand inflation dynamics and make informed decisions.
While the Consumer Price Index (CPI) measures what consumers pay, the PPI focuses on what producers charge, offering a broader view of inflationary pressures throughout the economy. Understanding the PPI is essential not only for economists and investors but also for anyone interested in how pricing trends affect markets, business strategies, and household finances.
What Is the Producer Price Index (PPI)?
Definition and Purpose
The Producer Price Index is a family of indexes published by the U.S. Bureau of Labor Statistics (BLS) that measure the average change over time in prices received by domestic producers for their goods, services, and construction.
Unlike CPI, which reflects the final cost to consumers, PPI captures prices at earlier stages of production. This includes prices for raw materials, intermediate goods, and finished products sold by manufacturers and wholesalers.
Key Features of the PPI
| Feature | Details |
|---|---|
| Coverage | Measures prices for goods, services, and construction at the wholesale level |
| Frequency | Released monthly by the BLS |
| Categories | Tracks different industries, including manufacturing, agriculture, and energy |
| Importance | Used to predict CPI trends and inform economic policy |
How PPI Works and Why It Matters
Calculation Methodology
The PPI is calculated using price data collected from a sample of producers across the country. These prices are reported monthly and categorized into various indexes based on:
-
Industry classification
-
Commodity classification
-
Stage of processing
The final PPI figure is typically reported as a percentage change from the previous month and year-over-year (YoY).
Formula:
The PPI base period is usually set to 100, allowing easy comparison across time periods.
Why It Matters
The PPI has several important uses:
-
Inflation Indicator: PPI is a leading indicator of consumer inflation. If producer prices rise, those costs may be passed on to consumers.
-
Business Planning: Businesses use PPI data to anticipate input cost changes and set prices accordingly.
-
Economic Forecasting: Economists analyze PPI trends to forecast future economic activity.
-
Monetary Policy: The Federal Reserve and other central banks consider PPI when evaluating inflation pressures and setting interest rates.
Real-World Applications of PPI
PPI Across Different Sectors
| Sector | Examples of Items Measured |
|---|---|
| Manufacturing | Steel, vehicles, machinery |
| Agriculture | Grains, livestock, dairy |
| Energy | Oil, natural gas, electricity |
| Services | Transportation, healthcare, financial services |
| Construction | Residential and commercial building materials |
The PPI helps track sector-specific trends, which is valuable for investors and businesses operating in those industries.
How Businesses Use PPI
Companies across all industries monitor the PPI to stay competitive and manage costs. Here's how:
-
Pricing Strategies: If PPI shows rising input costs, businesses may raise prices to maintain margins.
-
Contract Adjustments: PPI is often used as a price escalation clause in long-term supply contracts.
-
Budget Planning: Helps CFOs and financial planners anticipate cost increases in raw materials or logistics.
7 Key Facts About PPI You Should Know
-
Different From CPI: PPI measures wholesale prices, while CPI focuses on retail consumer prices.
-
Leading Indicator: Rising PPI often foreshadows rising CPI and consumer inflation.
-
Monthly Release: The BLS publishes PPI data around the second week of each month.
-
Multiple Indexes: PPI includes over 10,000 separate indexes for different products and industries.
-
Used Globally: Other countries also produce their own versions of PPI for economic analysis.
-
Not Affected by Taxes or Margins: Unlike CPI, PPI excludes sales taxes and distribution costs.
-
Adjusted for Seasonality: Seasonally adjusted PPI figures are often more accurate for trend analysis.
Comparison of PPI vs CPI
| Criteria | PPI | CPI |
|---|---|---|
| Measures | Prices received by producers | Prices paid by consumers |
| Focus | Wholesale level | Retail level |
| Includes Services? | Yes | Yes |
| Includes Taxes? | No | Yes |
| Use Case | Business, economic forecasting, policy | Consumer trends, cost of living analysis |
| Release Frequency | Monthly | Monthly |
| Published By | U.S. Bureau of Labor Statistics | U.S. Bureau of Labor Statistics |
Conclusion
The Producer Price Index is more than just an economic statistic—it's a powerful tool for understanding the forces that drive inflation and economic growth. Whether you're a business owner strategizing for future costs, an investor watching inflation trends, or a policymaker crafting fiscal responses, the PPI offers essential data for informed decision-making.
In a time of economic uncertainty and market volatility, paying attention to indicators like the PPI can help stakeholders stay ahead of the curve. As the global economy continues to evolve, the relevance of the Producer Price Index will only increase in helping navigate both opportunities and risks.


